 Alina Grubnyak/unsplash.com
Optimization problems are super difficult to reason about because they involve relationships between several choices that permute with scale. For example, when merge-sort is described, it carries a spatial sense like you are splitting, re-ordering, and finally joining sub-sequences to sort an array. Optimization and approximation algorithms consume more oxygen in your brain to mentally test or verify. In previous posts, we explored the traveling salesman problem with the greedy approximation of nearest-neighbor. Traversing the nodes of a network by distance to the current element may seem simple, but if you had a scatter-plot of locations to visit, it would at least take some mental algebra to calculate the results of this approach.
qualitative analysis
Comparing algorithms in this space requires a data-driven approach. If we
implement new types of the DroneRouter interface, then we can measure the
total length of each router’s the solution path and their average run-times. The
result would be an X-Y plot of time spent solving and relative efficiency. We’ll
get there. But just knowing one algorithm yields a shorter route for a given
input is not intuitive to understand. Having a visual representation of the
routes would enhance the manual analysis of the results. In this post, we’ll work
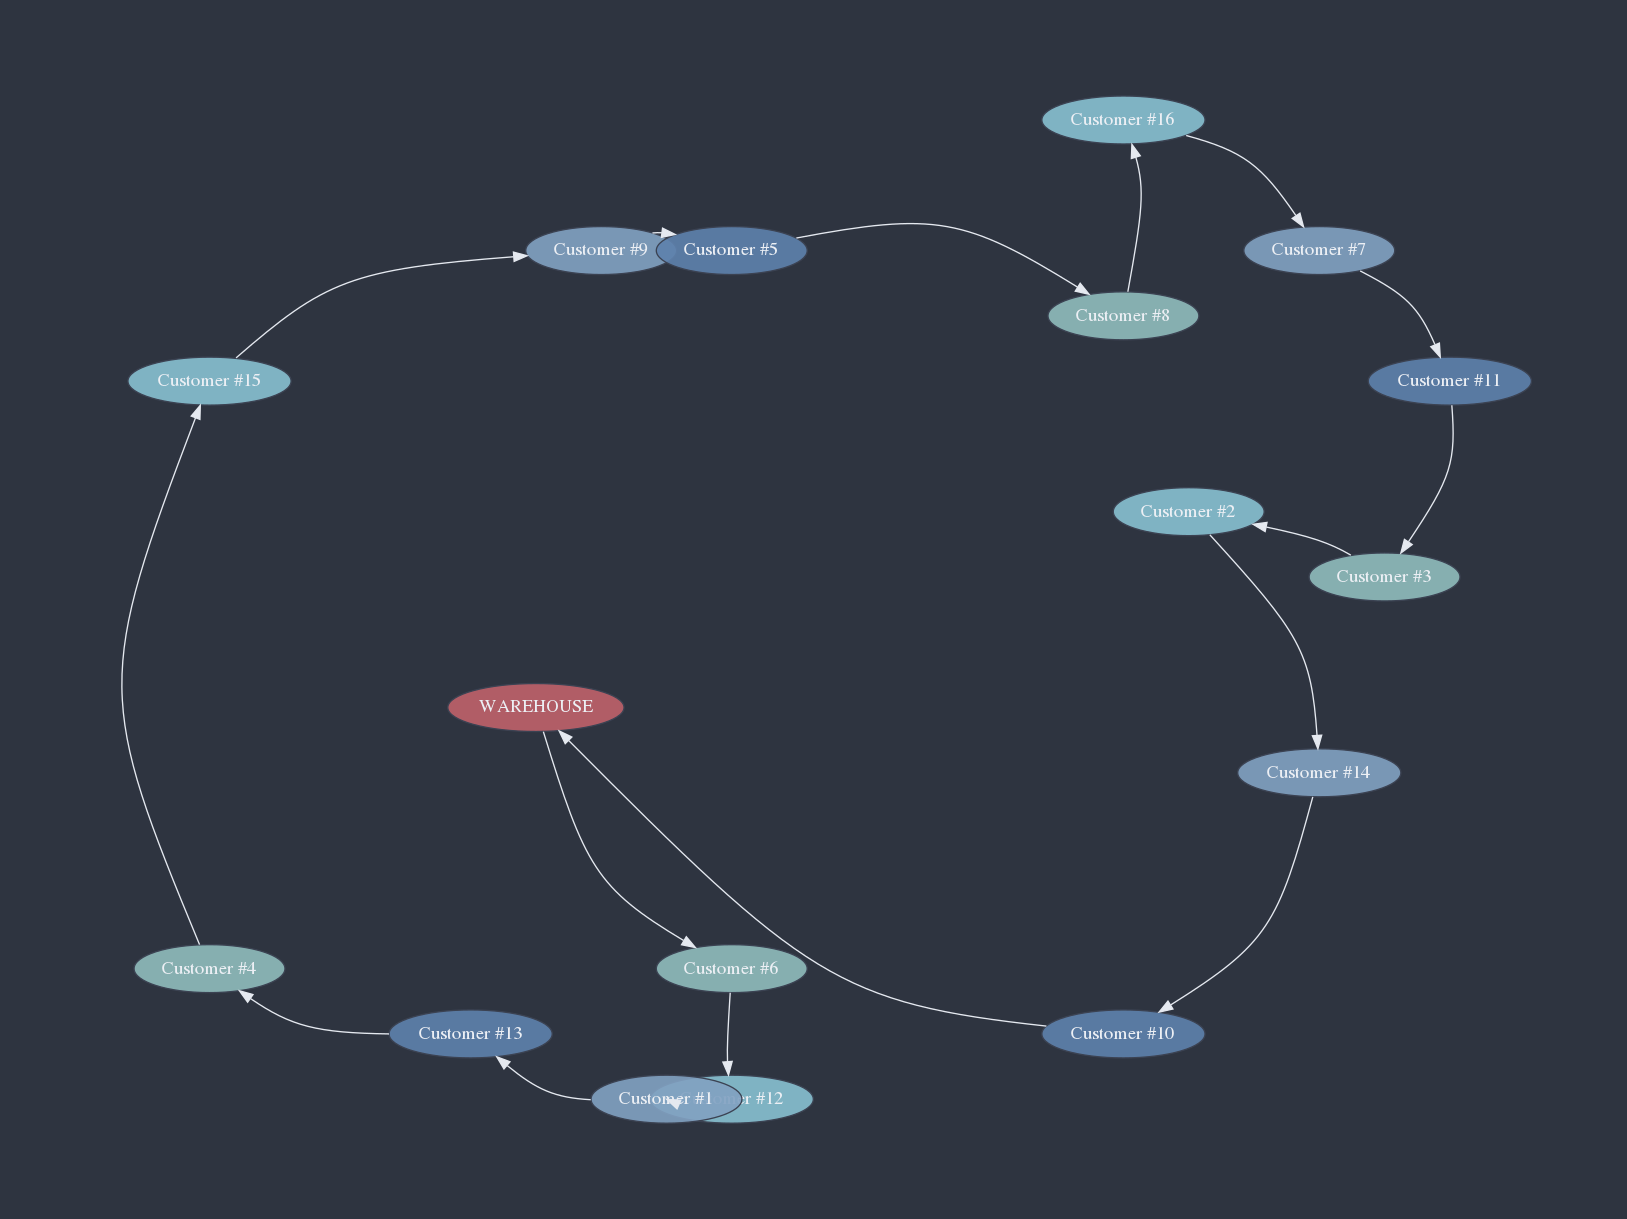
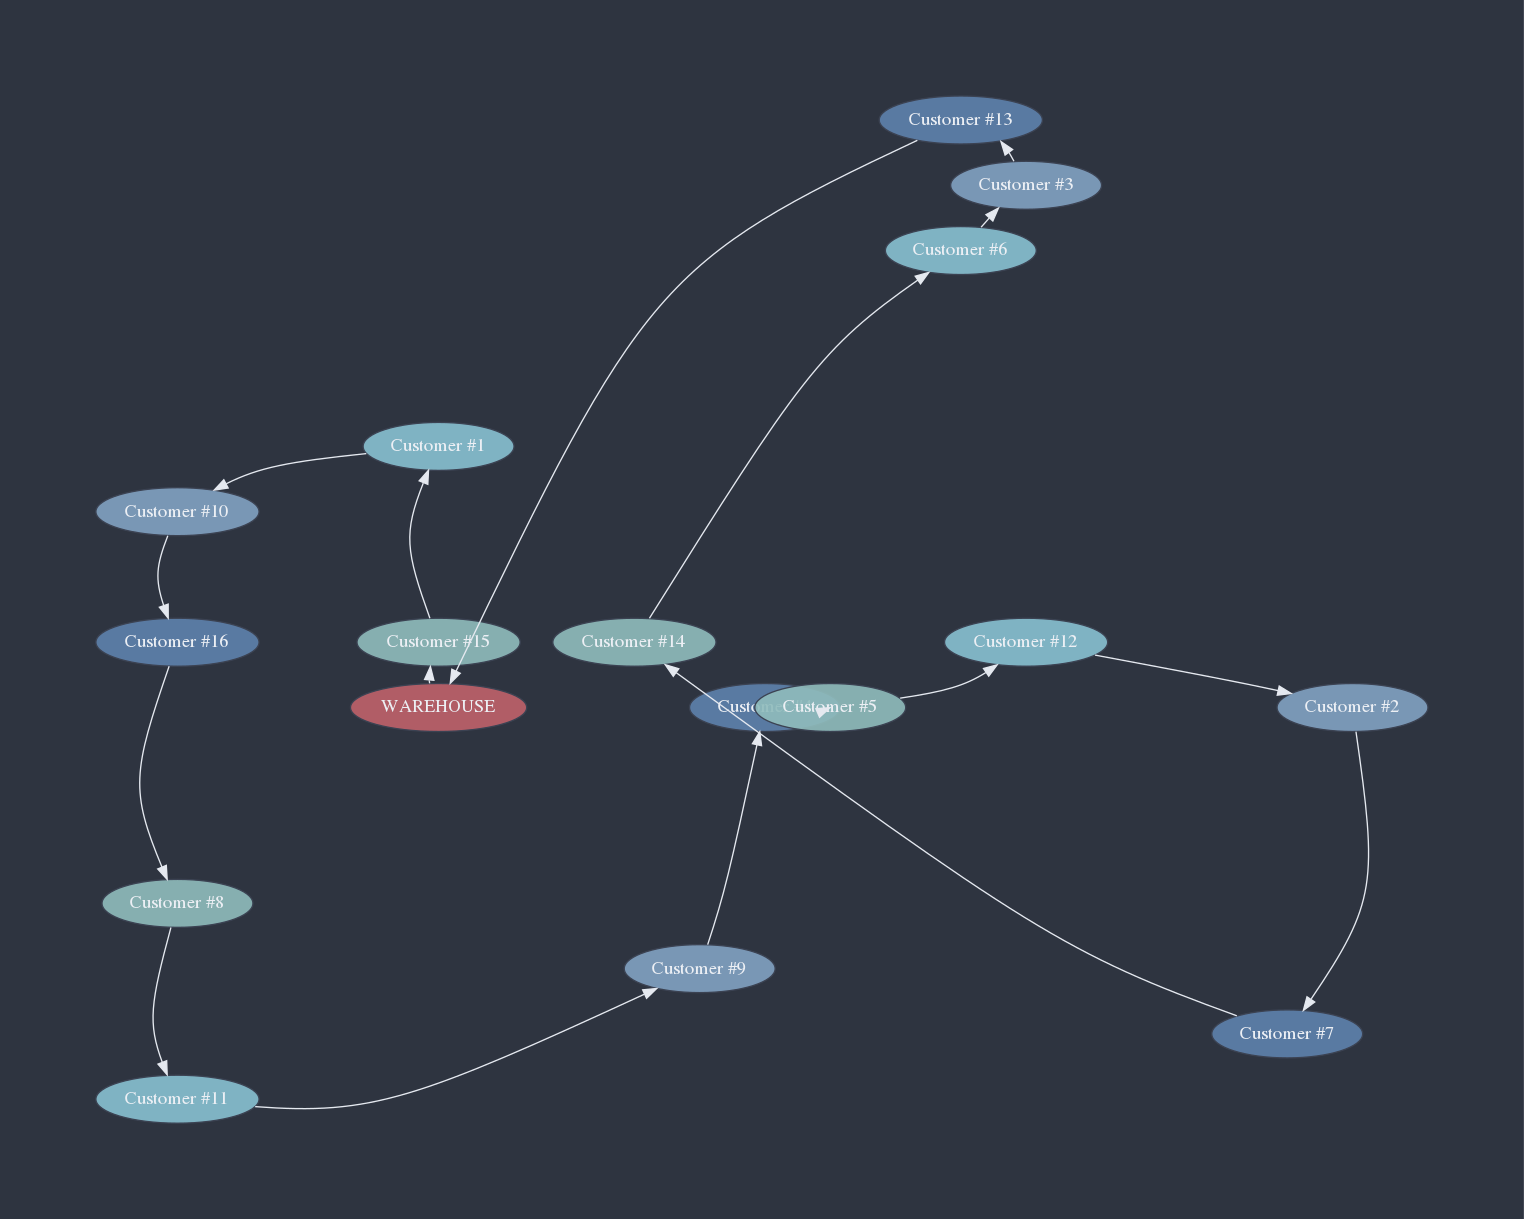
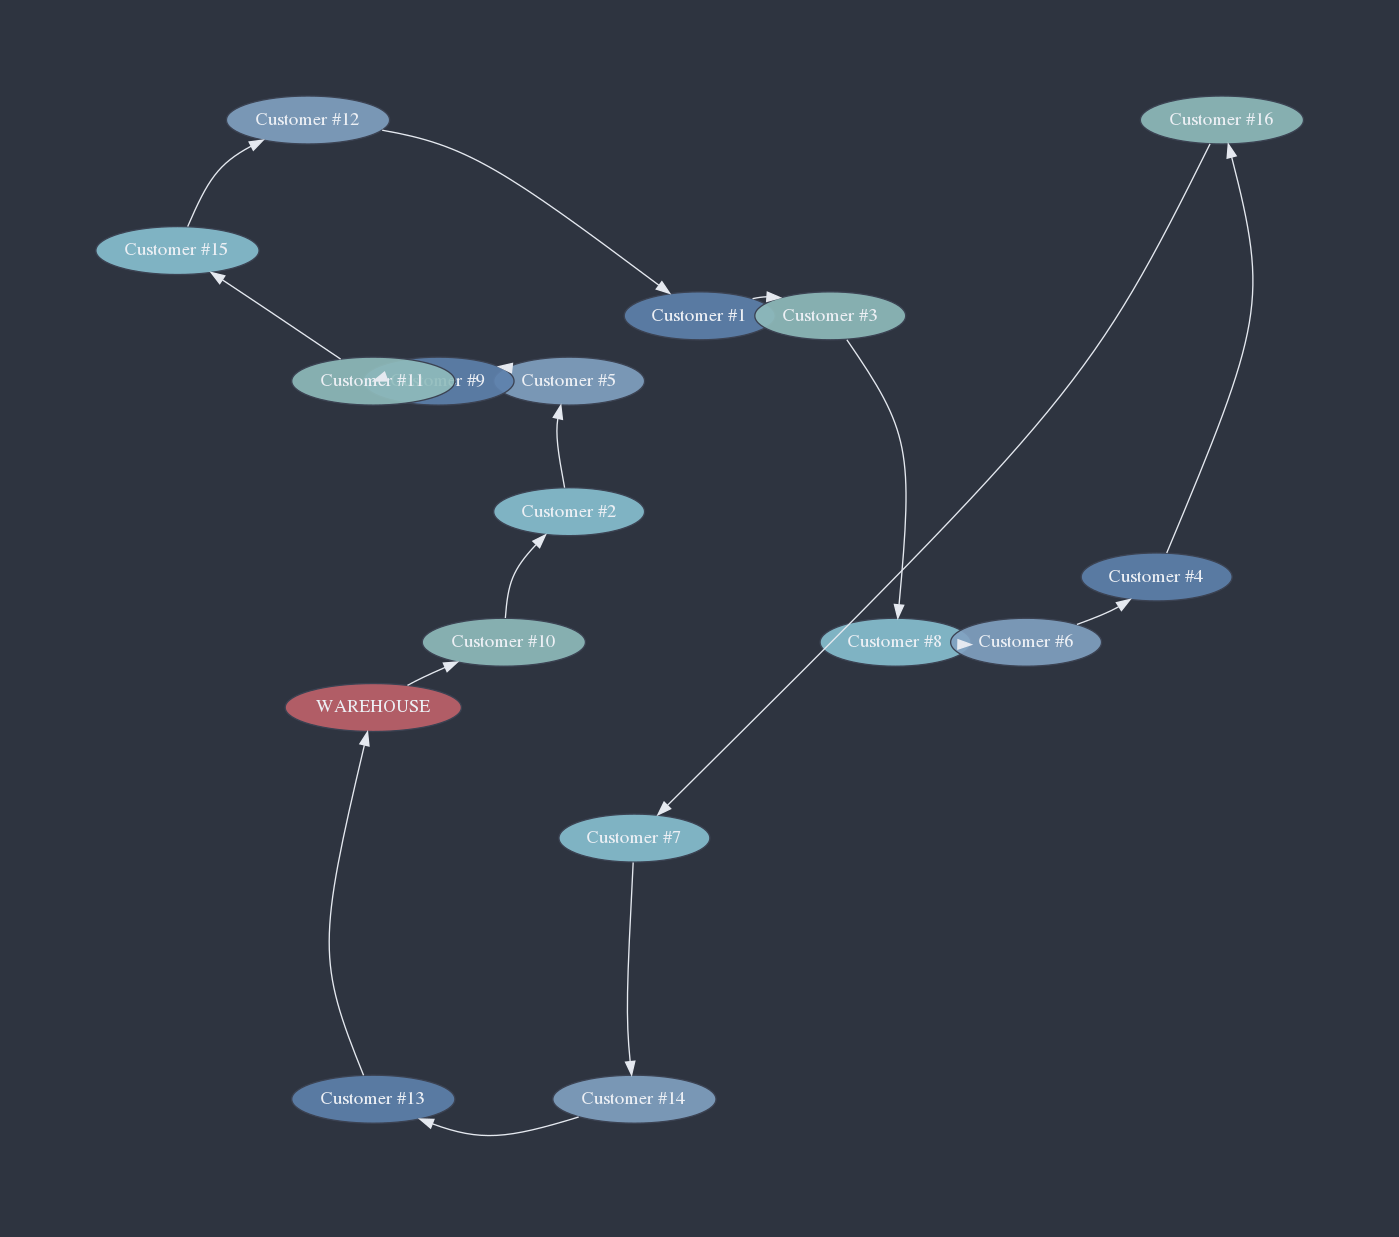
towards developing these visualizations:
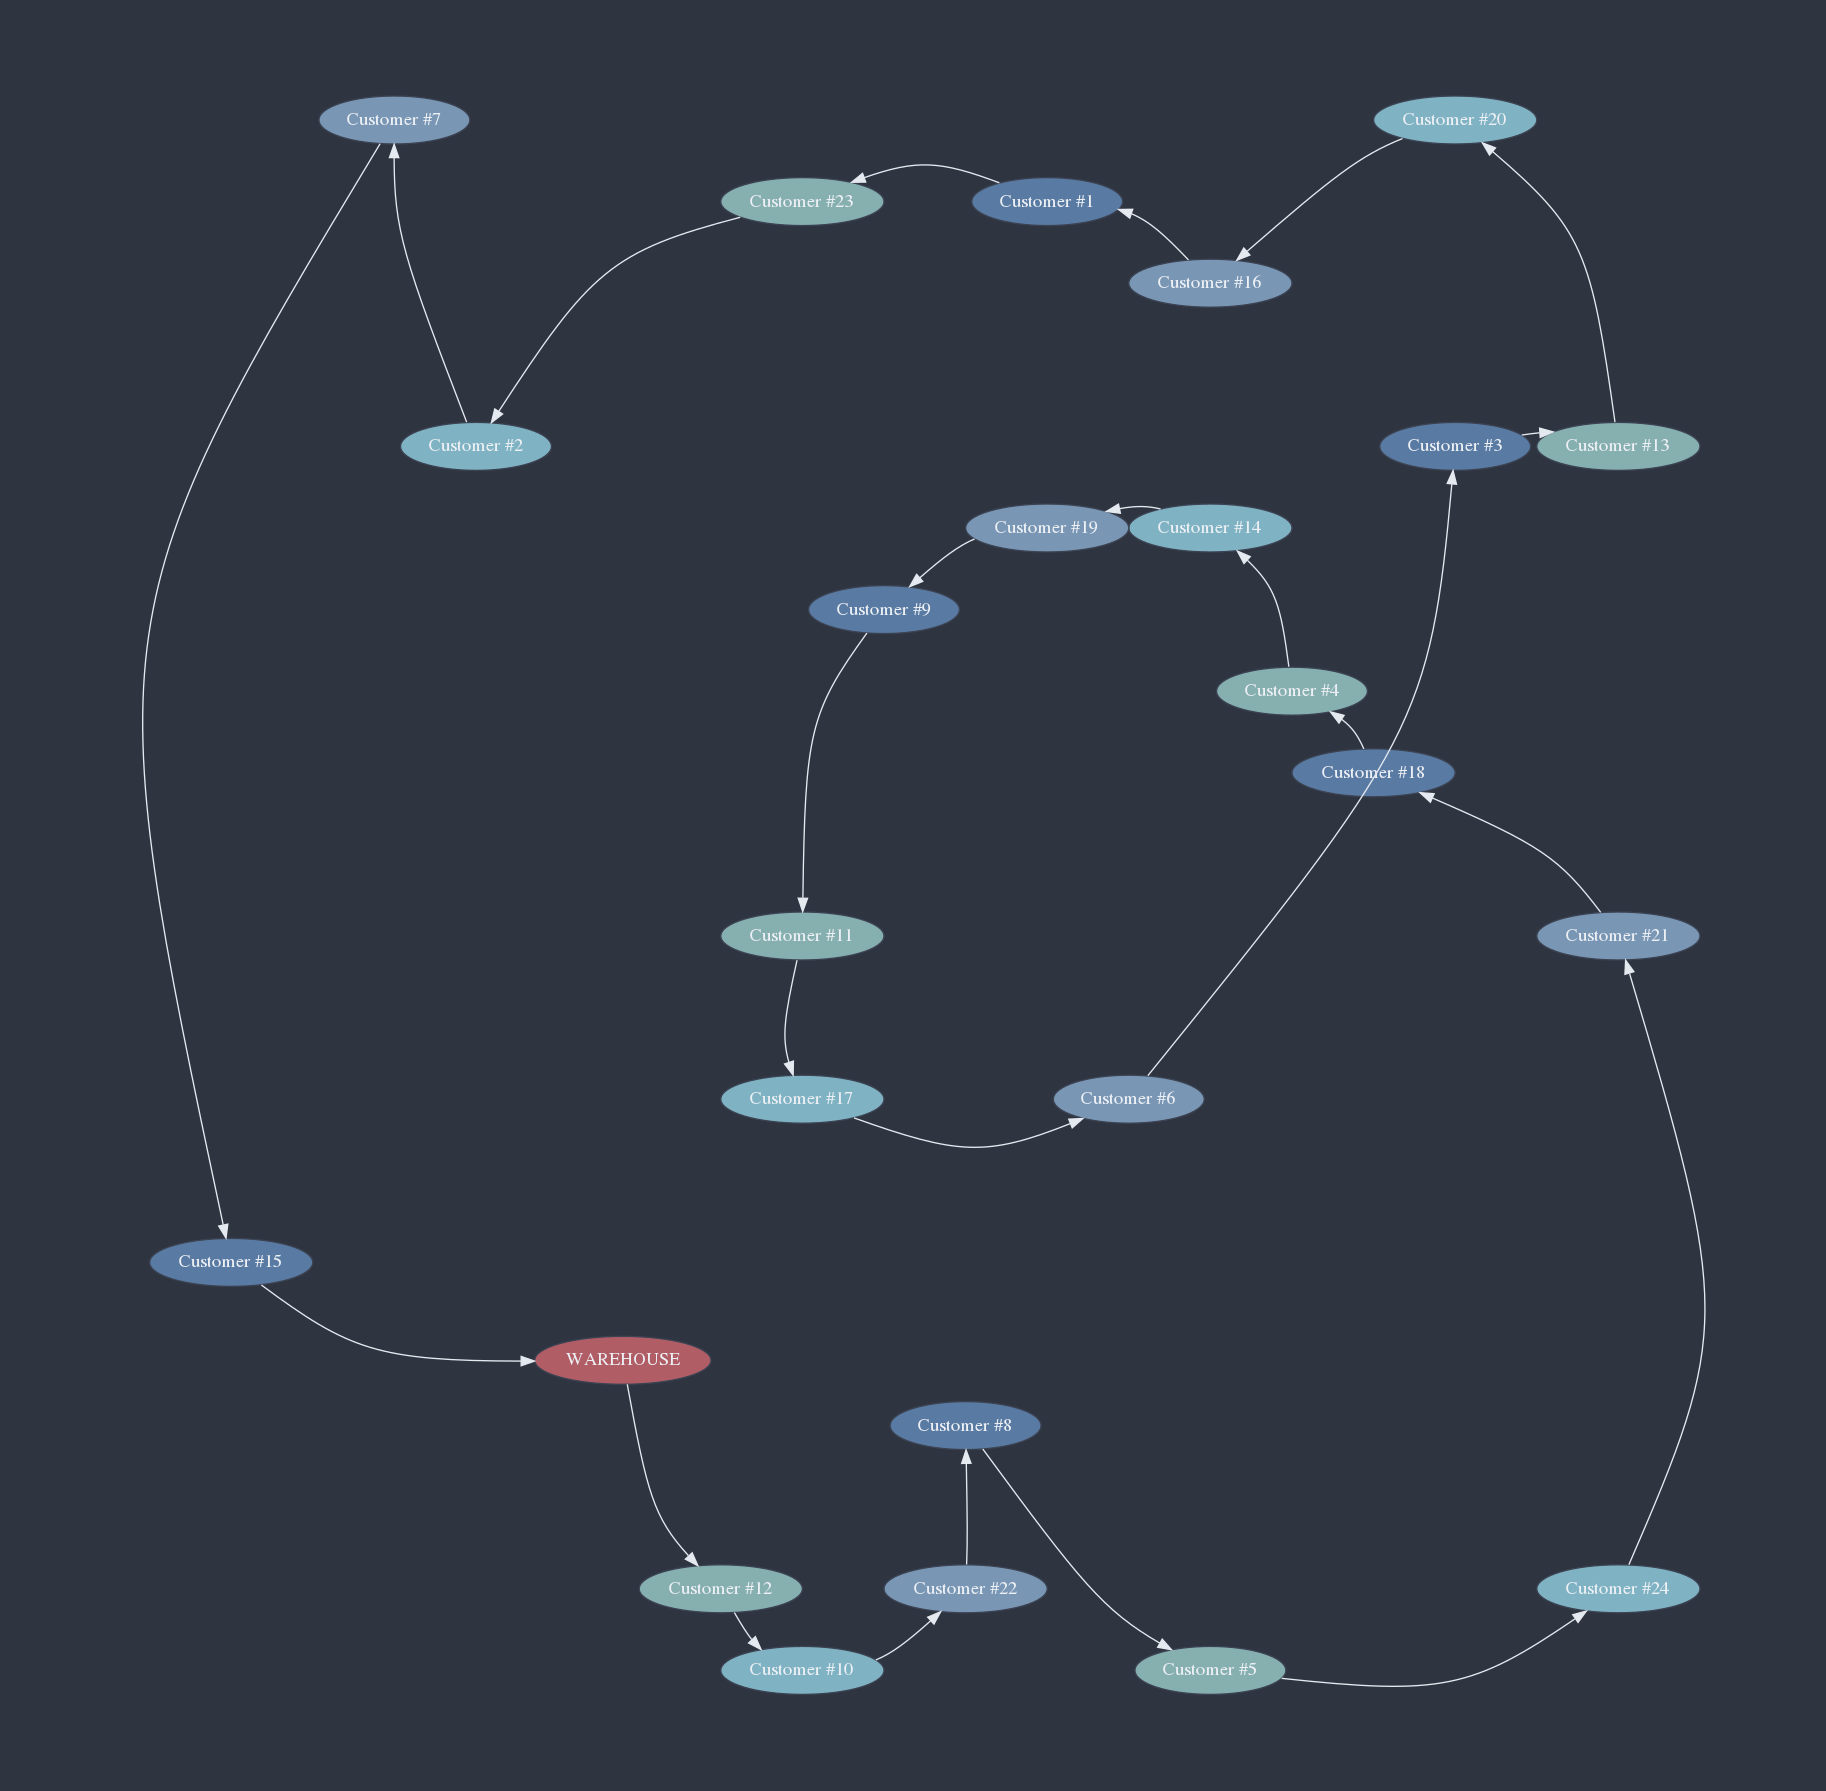 generated from DOT by GraphViz
Before we proceed to implement a new router, we will design a semi-automatic system for visualizing the drone’s route as a directed graph. First, we can use a Junit test drive the graph creation since that is easy to run. If it is not practical to run this routine in our unit test suite, we can use tags to exclude it too. Second, we will need an apparatus to generate pseudo-random destinations to route. Last of all, we need to convert the solution route into a visual format. I decided to use GraphViz to render the diagrams. It is an OSS utility that can read an input script in the format of DOT language and writes an image to depict the graph. If our system has a component to convert routes to DOT files, and then those could be viewed manually for comparison.
test routine
Before drilling down into all the components, we review the test routine to
understand how the visualization system operates at the high-level.
DroneRouterTest is a new test class that uses the Junit life-cycle to run: load
-> setup -> test -> export. In the load and setup phases, it will prepare
random input data. In the test function, a route is created with a router
instance, and it is transcribed to an output file in the end. These files can
be rendered into images using GraphViz tools.
package io.seedshare.tsp.api;

import static java.lang.Math.abs;
import static java.lang.Math.sqrt;

import io.seedshare.tsp.api.impl.NNDroneRouter;
import io.seedshare.tsp.model.CoordinateGrid;
import io.seedshare.tsp.model.ServiceDestination;
import io.seedshare.tsp.test.DestinationDotWriter;
import io.seedshare.tsp.test.RandomDestinationGenerator;
import java.io.IOException;
import java.util.ArrayList;
import java.util.List;
import org.junit.jupiter.api.AfterEach;
import org.junit.jupiter.api.BeforeAll;
import org.junit.jupiter.api.BeforeEach;
import org.junit.jupiter.api.Test;

/**
 * Pseudo-random tests of drone routers. Each test writes a visualization file to
 * src/test/output/ that can be rendered with GraphViz.
 */
public class DroneRouterTest {

  private static RandomDestinationGenerator rdg;

  private ServiceDestination dc;
  private List<ServiceDestination> customers;
  private DroneRouter nn;
  private List<ServiceDestination> rt;
  private DestinationDotWriter dot;

  @BeforeAll
  public static void load() {
    CoordinateGrid grid = new CoordinateGrid(100, 100, 5);
    rdg = new RandomDestinationGenerator(313L, grid);
  }

  @BeforeEach
  public void setup() {
    dc = new ServiceDestination("WAREHOUSE", 24d, 24d);
    customers = new ArrayList<>(rdg.generateDistinct(24));
    nn = new NNDroneRouter(DroneRouterTest::euclideanDistance);
    rt = new ArrayList<>();
  }

  @Test
  public void test_nearestNeighbor() {
    dot = new DestinationDotWriter("src/test/output", "nearest-neighbor.gv");
    rt = nn.route(dc, customers);
  }

  @AfterEach
  public void exportGraph() throws IOException {
    dot.writeDotFile(dc, rt);
  }

  public static Double euclideanDistance(ServiceDestination sd1, ServiceDestination sd2) {
    double xdif = abs(sd1.getX() - sd2.getX());
    double ydif = abs(sd1.getY() - sd2.getY());
    return sqrt(xdif * xdif + ydif * ydif);
  }
}
data setup
As a starting point, we will write a test module to generate destinations with
random coordinates. This is not a part of the deliverable API, so I am placing
it under src/test/java in a test package. This module depends on 2 parts: a
random number generator for coordinates and a set of bounds to constrain the
coordinates. The random number can be generated easily with java.util.Random,
but the constraints, e.g. min and max coordinates, should be modeled in a class.
The class, CoordinateGrid will define min and max values for X and Y as well
as a snap measurement, which is like defining how large the squares on a
checkerboard.
package io.seedshare.tsp.model;

import static java.lang.Math.floor;
import static java.lang.Math.round;
import static java.lang.Math.toIntExact;

/** Designates a boundaries for coordinates. */
public class CoordinateGrid {
  private final double xMin;
  private final double xMax;
  private final double yMin;
  private final double yMax;
  private final double snap;

  public CoordinateGrid(int sqr) {
    this(sqr, sqr);
  }

  public CoordinateGrid(double xMax, double yMax) {
    this(xMax, yMax, 1d);
  }

  public CoordinateGrid(double xMax, double yMax, double snap) {
    this(0d, xMax, 0d, yMax, snap);
  }

  public CoordinateGrid(double xMin, double xMax, double yMin, double yMax, double snap) {
    if (xMin > xMax || yMin > yMax) {
      throw new IllegalStateException("min values must be less or equal to than max values");
    }
    this.xMin = xMin;
    this.xMax = xMax;
    this.yMin = yMin;
    this.yMax = yMax;
    this.snap = snap;
  }

  /* public "getter" methods ... */

  /** @return all valid X-values */
  public double[] getXDomain() {
    return domain(xMin, xMax);
  }

  /** @return all valid Y-values */
  public double[] getYDomain() {
    return domain(yMin, yMax);
  }

  /**
   * Calculates all possible values in the domain.
   *
   * @param min lower-bound
   * @param max upper-bound
   * @return array of values
   */
  private double[] domain(double min, double max) {
    double v = floor((max - min) / snap) + 1d;
    double[] domain = new double[toIntExact(round(v))];
    int idx = 0;
    for (double d = min; d <= max; d += snap) {
      domain[idx] = d;
      idx++;
    }
    return domain;
  }
}
The grid class is shown above with getters omitted for brevity. The most
important part is the domain function. This will iterate from min to max
on intervals of the snap value and collect each value in an array. In other
words, it provides every valid value between and including min and max for the
X or Y dimension. In our generator, we can take the coordinate value from the
domain of values by reading a random index in this array. You may be thinking
that it would be simpler to use the numbers provided by Random directly as the
coordinates, and you’re right. However, the grid system offers an ergonomic and
efficient way to control the destination constraints at a high-level. Getting
the domain of valid values will make it faster to generate unique locations, and
the snap can be used to control the spacing of them. Now we can proceed with a
generator.
package io.seedshare.tsp.test;

import static java.lang.String.format;
import static java.util.stream.Collectors.toCollection;

import io.seedshare.tsp.model.CoordinateGrid;
import io.seedshare.tsp.model.ServiceDestination;
import java.util.ArrayList;
import java.util.Arrays;
import java.util.HashSet;
import java.util.LinkedList;
import java.util.List;
import java.util.Random;
import java.util.Set;

/** Provides random and/or distinct service destinations in a coordinate grid. */
public class RandomDestinationGenerator {
  private final long seed;
  private final CoordinateGrid grid;
  private final Random random;

  public RandomDestinationGenerator(long seed, CoordinateGrid grid) {
    this.seed = seed;
    this.grid = grid;
    this.random = new Random(seed);
  }

  /**
   * Creates random service destinations.
   *
   * @param limit number of destinations to generate
   * @return list of destinations
   */
  public List<ServiceDestination> generate(int limit) {
    List<ServiceDestination> destinations = new LinkedList<>();
    double[] x = grid.getXDomain();
    double[] y = grid.getYDomain();
    for (int i = 1; i <= limit; i++) {
      int xIdx = random.nextInt(x.length);
      int yIdx = random.nextInt(y.length);
      ServiceDestination dest = new ServiceDestination(format("Customer #%s", i), x[xIdx], y[yIdx]);
      destinations.add(dest);
    }
    return destinations;
  }

  /**
   * Creates random service destinations with unique coordinates.
   *
   * @param limit number of destinations to generate, must be within grid area
   * @return set of distinct destinations
   */
  public Set<ServiceDestination> generateDistinct(int limit) {
    List<Double> xs = domainList(grid.getXDomain());
    List<List<Double>> xys = new ArrayList<>();
    for (Double x : xs) {
      // add all possible x-y pairs
      xys.add(domainList(grid.getYDomain()));
    }

    // check bounds
    if (limit > xs.size() * xys.get(0).size()) {
      throw new IllegalArgumentException("limit exceeds the x or y domain size");
    }

    // create unique destinations
    Set<ServiceDestination> destinations = new HashSet<>();
    for (int i = 1; i <= limit; i++) {
      int xIdx = random.nextInt(xs.size());
      double x = xs.get(xIdx);
      List<Double> ys = xys.get(xIdx);
      int yIdx = random.nextInt(ys.size());
      double y = ys.remove(yIdx);
      if (ys.isEmpty()) {
        xs.remove(xIdx);
      }
      ServiceDestination dest = new ServiceDestination(format("Customer #%s", i), x, y);
      destinations.add(dest);
    }
    return destinations;
  }

  private List<Double> domainList(double[] domain) {
    return Arrays.stream(domain).boxed().collect(toCollection(() -> new LinkedList<>()));
  }

  /* getters ... */
}
In this component, the generate method is getting the X & Y domains,
iterating up to the limit parameter, getting random indices, and building
a new instance of ServiceDestination by reading each domain with its random
index. The generateDistinct method follows this pattern, except it will
remove values from the domain when they are selected. This guarantees that each
destination is unique without using a nested loop to check for duplicates. These
features provide the ability to generate destinations with random coordinates.
Another notable feature, the seed value for the RNG can be injected into the
instance. The seed controls the sequence of numbers that are generated such that
using the same seed yields the same “random” destinations. Having deterministic
generation can be useful to recreate certain inputs as we tweak the algorithm.
DOT translation
Next, we need a module for converting a collection of destinations to a DOT file.
- Encode routes in DOT format
- Write the output to a file
Encoding a service destination requires two lines of output. First, there’s a node declaration that identifies the node and its attributes, e.g. its position. For example, the following lines represent a node labeled with id1 at (x,y) that precedes the node of id2. These are simple DOT statements, and our writer will add more attributes to enhance the visuals.
$id1 [pos=$x,$y]
$id1 -> $id2
Writing files is not too hard in Java. I will opt to use Java NIO for this. The component will take an output filename and have a method to write a route of destinations to it in DOT representation.
package io.seedshare.tsp.test;

import io.seedshare.tsp.model.ServiceDestination;
import java.io.IOException;
import java.nio.file.Files;
import java.nio.file.Path;
import java.nio.file.Paths;
import java.nio.file.StandardOpenOption;
import java.util.List;

/**
 * Writes service destinations as a route to a DOT language file for rendering.
 *
 * @author kevvurs
 */
public class DestinationDotWriter {
  private final Path outputPath;
  private final ColorWheel colors;

  /**
   * Creates a new writer.
   *
   * @param fileLocation location where the output file will be created
   * @param fileName name of the file to create including the extension
   */
  public DestinationDotWriter(String fileLocation, String fileName) {
    outputPath = Paths.get(fileLocation, fileName);
    colors = ColorWheel.nord(); // TODO: add customization hook
  }

  /**
   * Creates or overwrites the filename given in the constructor with a representation of the given
   * route in DOT spec.
   *
   * @param dc start and end point
   * @param destinations in-order route destinations
   * @throws IOException file-handling error
   */
  public void writeDotFile(ServiceDestination dc, List<ServiceDestination> destinations)
      throws IOException {
    String stmnts = toDotStatements(dc, destinations);
    String content = String.format(dotTemplate(), stmnts);
    Files.write(
        outputPath,
        content.getBytes(),
        StandardOpenOption.CREATE,
        StandardOpenOption.TRUNCATE_EXISTING,
        StandardOpenOption.WRITE);
  }

  private String toDotStatements(ServiceDestination dc, List<ServiceDestination> destinations) {
    final StringBuilder builder = new StringBuilder();
    builder.append(toDotNode(dc, "#BF616A"));
    destinations.forEach(
        (sd) -> {
          builder.append(toDotNode(sd));
        });

    ServiceDestination left = dc;
    ServiceDestination right;
    for (ServiceDestination sd : destinations) {
      right = sd;
      builder.append(toDotEdge(left, right));
      left = right;
    }
    builder.append(toDotEdge(left, dc));
    return builder.toString();
  }

  private String toDotNode(ServiceDestination sd) {
    return toDotNode(sd, colors.next());
  }

  private String toDotNode(ServiceDestination sd, String color) {
    return String.format(
            "\t%s [fillcolor=\"%sE7\", fontcolor=\"#ECEFF4\", color=\"#3B4252\", pos=\"%f,%f!\"];",
            toDotNodeId(sd), color, sd.getX(), sd.getY())
        .concat(System.lineSeparator());
  }

  private String toDotEdge(ServiceDestination sd1, ServiceDestination sd2) {
    return String.format("\t%s -> %s;", toDotNodeId(sd1), toDotNodeId(sd2))
        .concat(System.lineSeparator());
  }

  private String toDotNodeId(ServiceDestination sd) {
    return new StringBuilder().append("\"").append(sd.getId()).append("\"").toString();
  }

  private static String dotTemplate() {
    return new StringBuilder()
        .append("strict digraph {")
        .append(System.lineSeparator())
        .append("\tgraph [pad=\"1,1\", scale=\"0.17\", bgcolor=\"#2E3440\", splines=\"curved\"];")
        .append(System.lineSeparator())
        .append("\tnode [style=\"filled\"];")
        .append(System.lineSeparator())
        .append("\tedge [color=\"#E5E9F0\"];")
        .append(System.lineSeparator())
        .append("%s")
        .append('}')
        .append(System.lineSeparator())
        .toString();
  }
}
Inside the DestinationDotWriter constructor, we set the filename for writing.
Then, calling writeDotFile with a distribution center location and service
destinations will yield a DOT file that encodes the route results. Other
functions in this class are used to build string templates to encode the service
destinations as edge and node statements. The output file will be created in on
running the test routine, and after it is generated, we can render an image with
CLI command:
neato -Tpng nearest-neighbor.gv -O
The writer class gives many attributes for graph sizing and styling. You can try tweaking these to produce different looking graphs. It is important to use neato to generate the graph since using the dot command will not use the pos attributes.
summary
By following all these steps, we created a versatile visualization system for routes as directed graphs. In the next post, I will explore different algorithms for TSP. Using this visualization technique, I can render side-by-side comparisons for the routing algorithms. Then, we’ll move on to benchmarking each router variation quantitatively. All the source-code from this post will be available in the GitHub repository.
various routes (NN)